
![]()

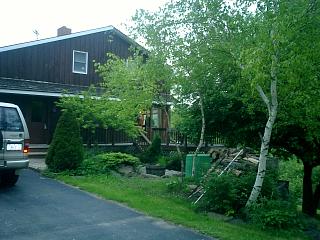
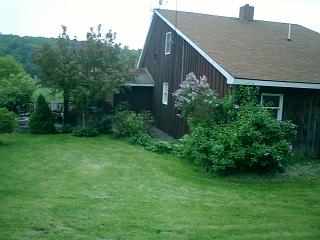
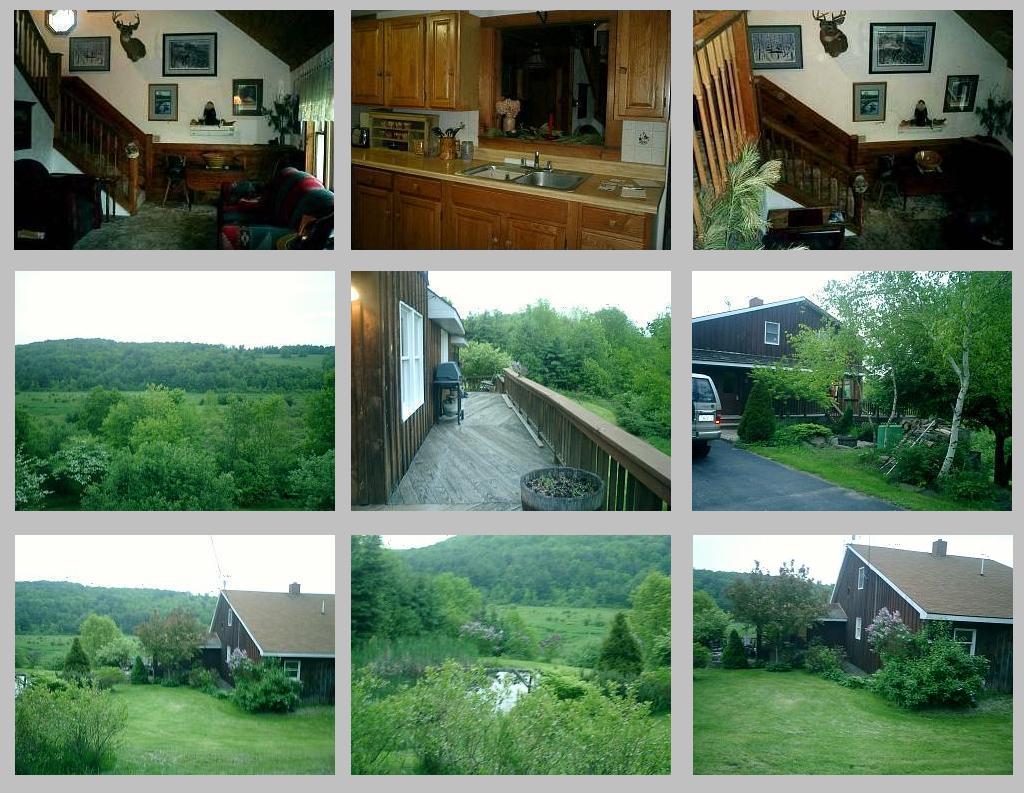
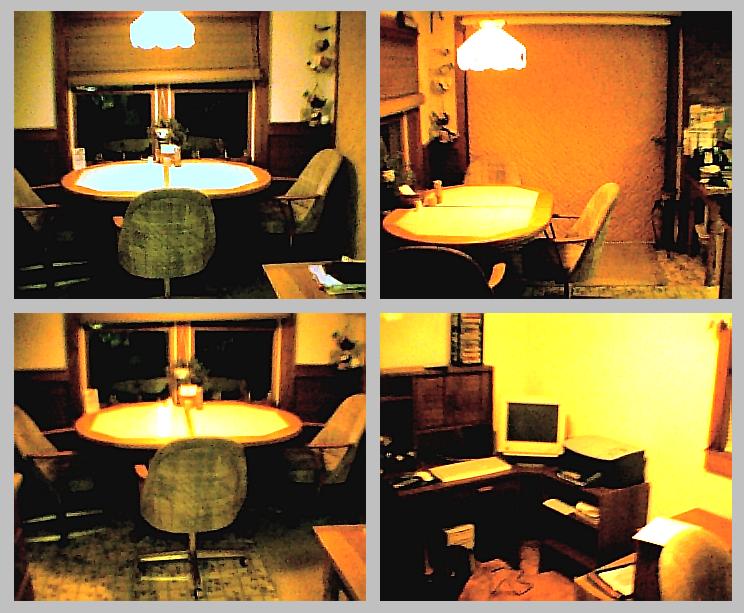
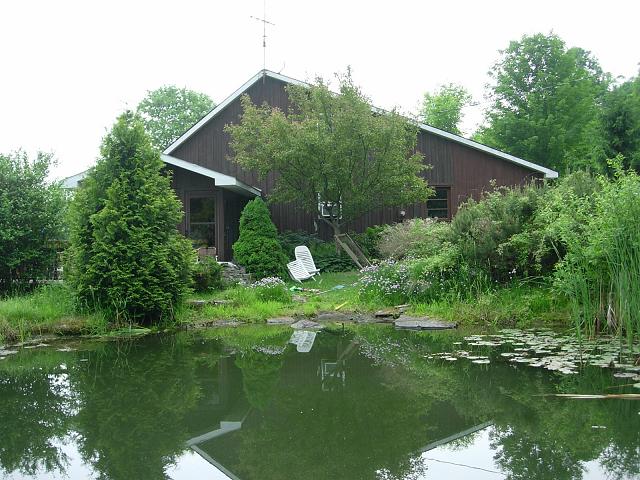
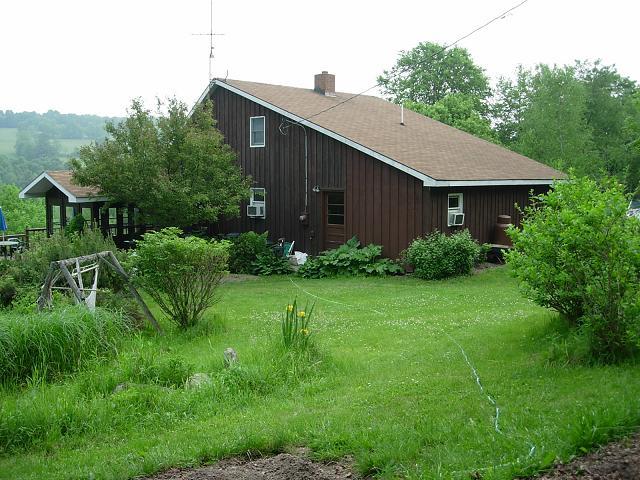
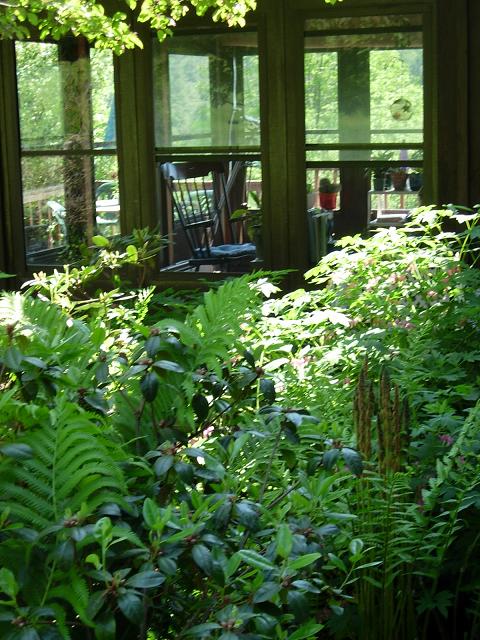
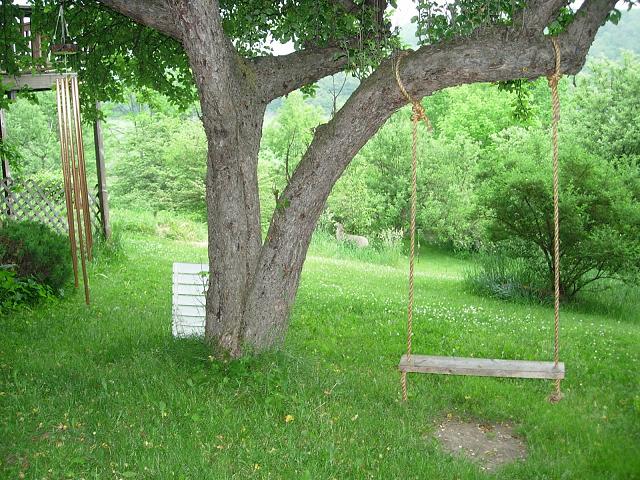
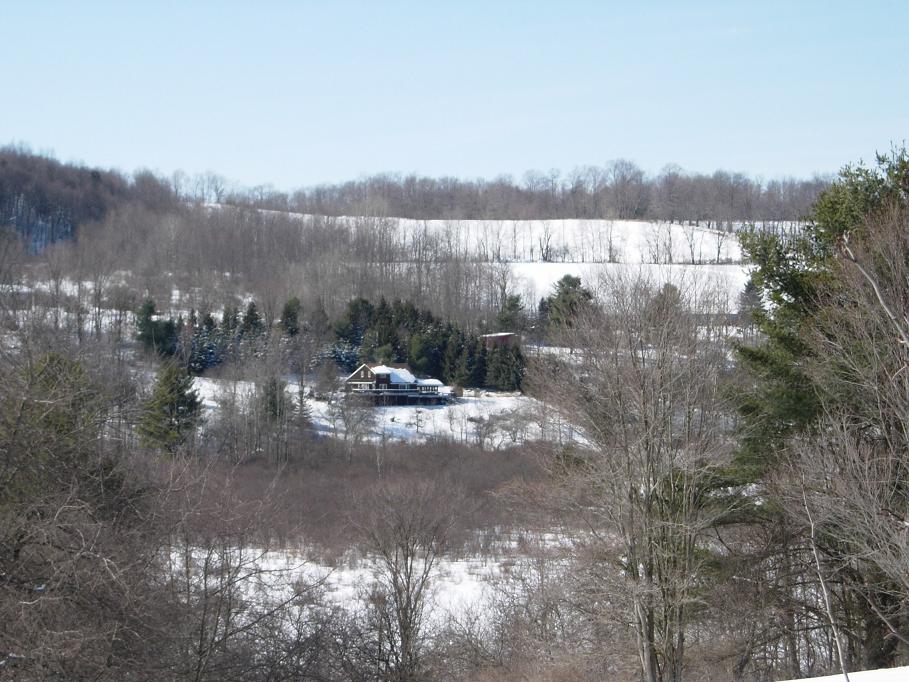
This page contains pictures of the house and property. The one with the group of shots was taken before we bought the house. At the bottom of the page is an energy study that I have been working on that looks at the heating of the house.
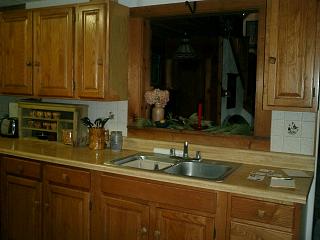
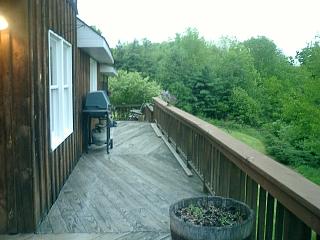
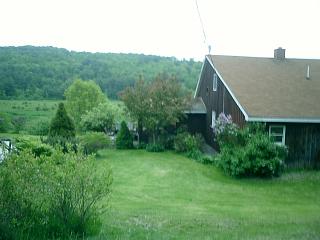
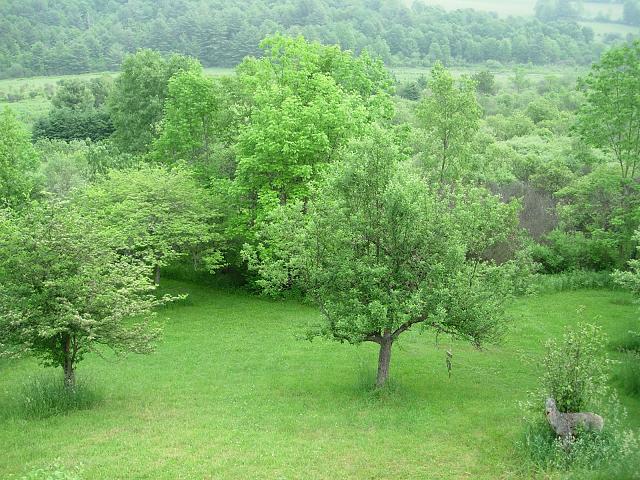
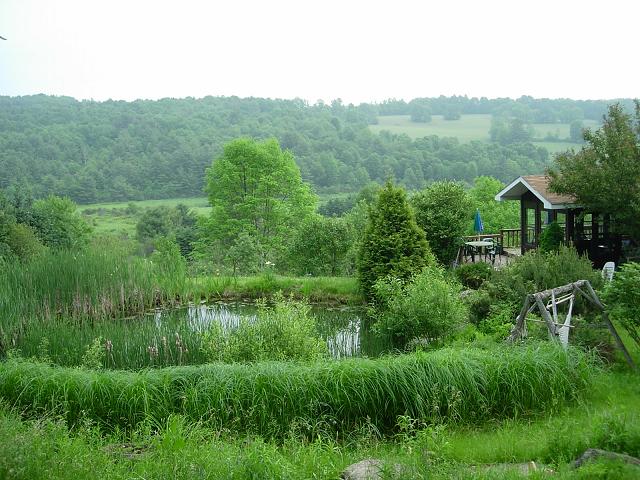
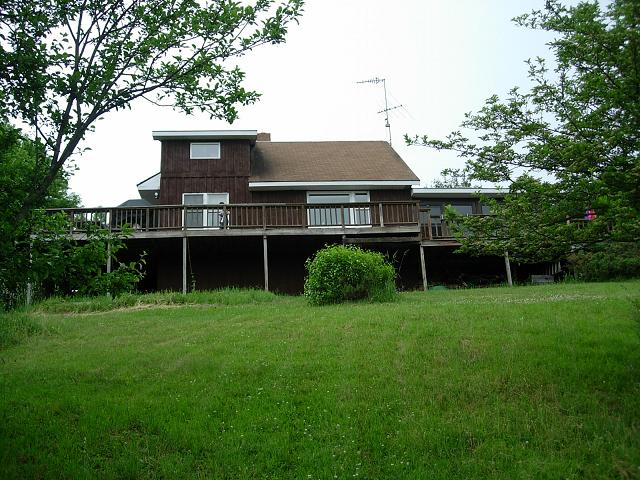
House Pictures


Energy Study
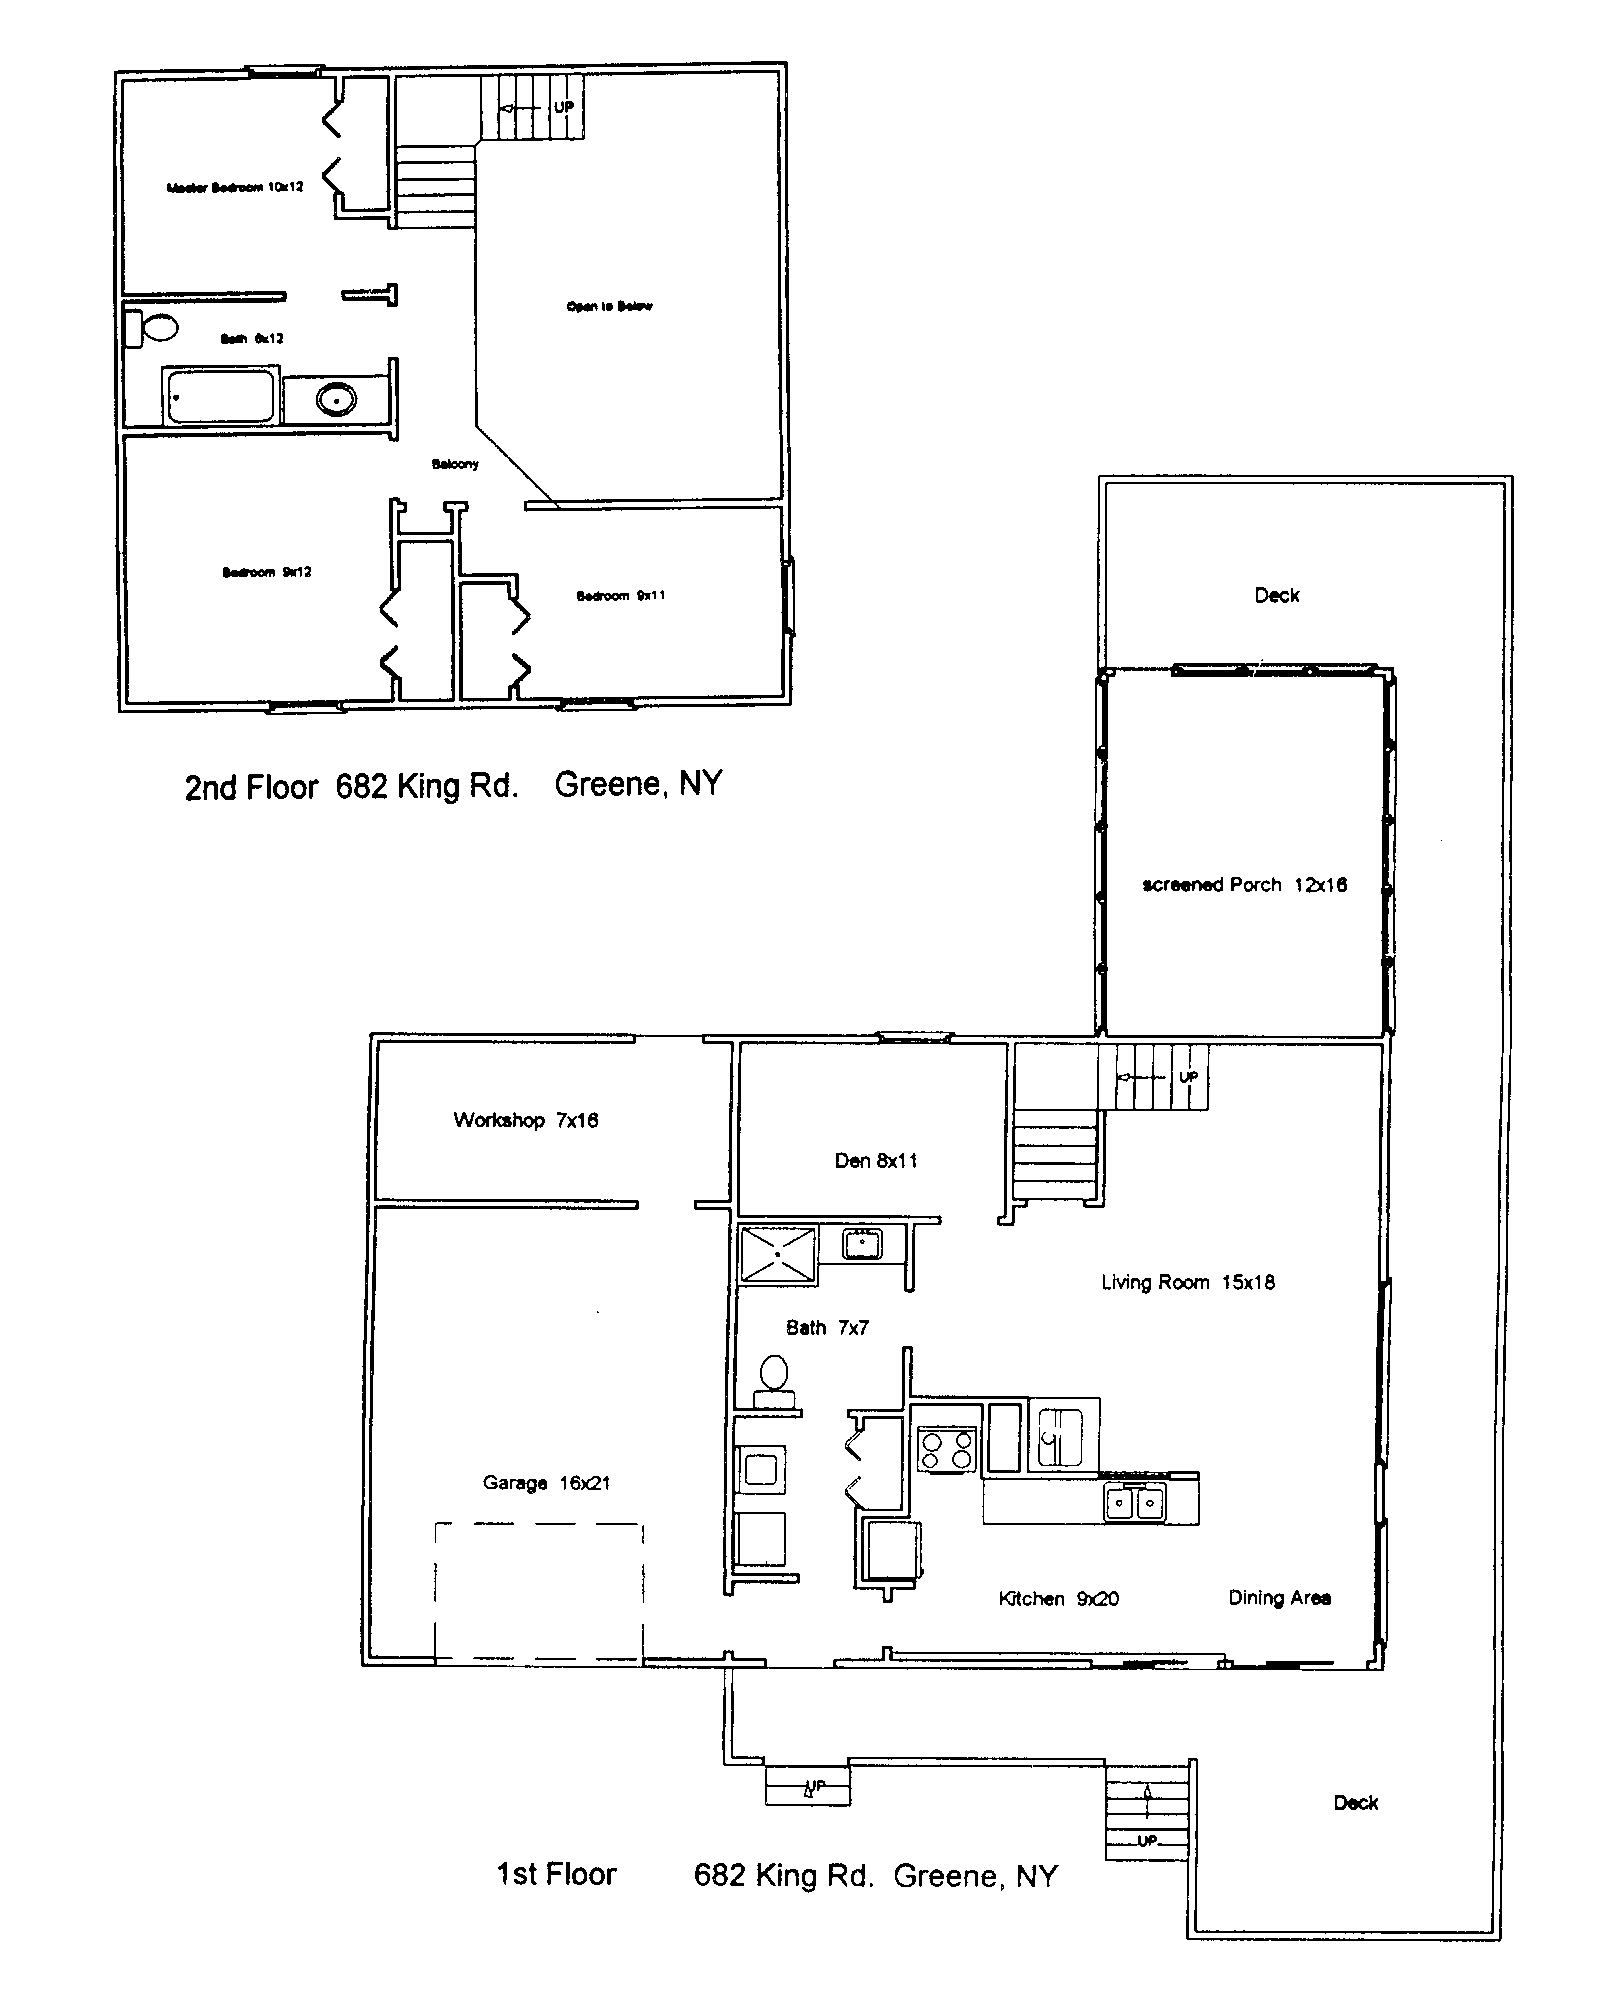
This energy study was done to estimate how much heat in terms of BTU the main part of the house needs to maintain room temperature. The house uses
wood and electricity for heat. The electric heaters of which there are 2 main ones at 2000 watts each. They are thermostat controlled and can be
independently turned on and off. A dehumidifier was used as a reference as well with the assumption that the 700W it consumes is liberated to the air
in the house. Points were found where the house temperature remains in equilibrium with 100% of 2000W and 4000W and also the 700W dehumidifier.
The
wood stove was then modelled as a simple black body radiator. The idea was to make the assumption that its surface area was all at the same
temperature. The surface area of the unit and part of the stove pipe within the room was measured. From this the black body radiation at the surface
temperature was calculated by going from wavelength of emission to energy of emission. The background radiation at room temperature is then subtracted
out. The assumption is that the room itself is radiating at room temperature.
A linear projection was drawn based on the reference electric heat and dehumidifier outputs and equilibrium points. The estimate for the wood stove seems
to correlate well with the assumptions made. All of this is summarized in the Heating Equilibrium Points
spreadsheet.
Another further study that would be worth undertaking is correlating the amount of electric heat consumed versus the published heating degree days to see how that looks. It would also be interesting to be able to calculate the efficiency of the woodstove as well.
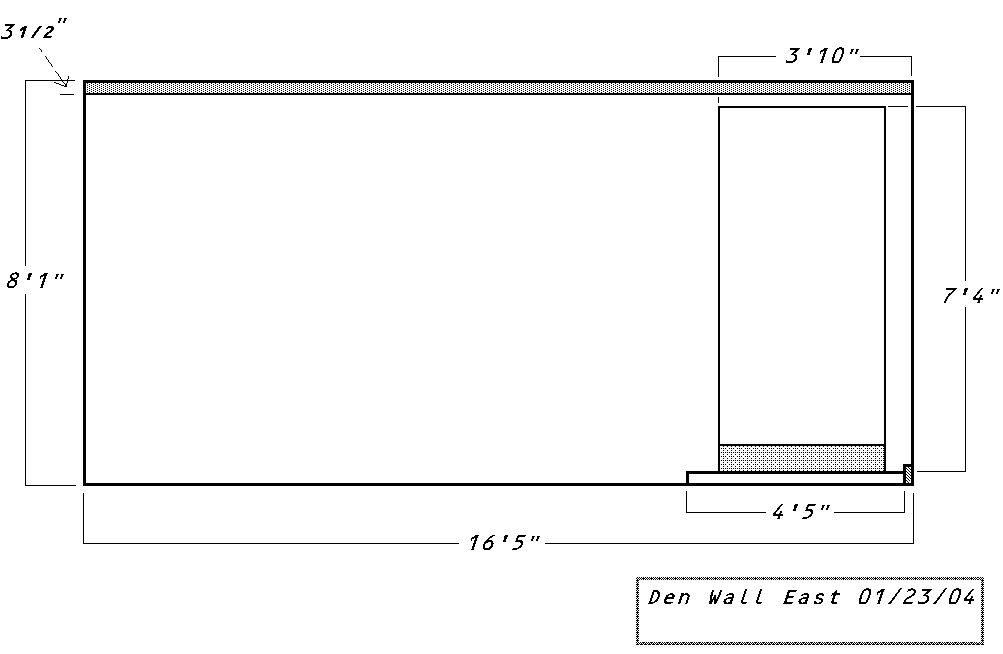
I have observed the way the den and shop, which are in what was the garage respond to a step function of heat input, rising in temperature to an equilibrium where it no longer can rise further. It was cold outside (12 degrees F) and it seemed like the heat would not be able to rise more that the 68 Degrees that the room was at. Making the assumption that the equilibrium point would be 70F and the room started at 43F, I followed the rise in temperature versus time. 53F after 1hr, 60 after 2, 64 after 3 and so on. After this I played around with equations that contained the natural log e knowing from differential equations that it would satisfy the relationship I saw. I found a curve that matched that contains the following data points.
Time    Degrees to
Hours   Final T(F)      Degrees (F)
0	27	        43             <-Initial Condition
1	16.37632781	53.62367219
2	9.932744912	60.06725509
3	6.024514324	63.97548568
4	3.654052647	66.34594735
5	2.216294963	67.78370504
6	1.344250846	68.65574915
7	0.815329352	69.18467065
8	0.49452225	69.50547775
9	0.299942907	69.70005709
10	0.181924569	69.81807543
The equation that generates this response is 70 - 27e-0.5t, which is very close to what was observed for an outdoor temperature of 12 degrees F. Naturally a family of curves would result one for each outdoor temperature that can occur, neglecting the effects of wind and sun on the house exterior. Heating a house a dissipative process where by the objective is to hold the internal temperature out of equilibrium with the outside temperature. Only a relatively thin boundary of insulation exists between the two. The temperature gradient is high through this boundary which makes it difficult to insulate the house well. There is the need to replace the heat that is lost to the outside with some energy source. The air inside the house has a low specific heat so it does not store much heat. The material that the house is constructed of from the interior and its contents contribute to the thermal mass of the house with their higher specific heat. This creates an integrator effect which tends to smooth out variations in temperature over time. From a qualitative perspective the worst case I can think of would be a room with a good air temperature but a cold cement floor. It will not feel comfortable despite heating the air, it will take time for the floor to become warm enough to make it feel comfortable.
I have also been doing some temperature data logging. The temperature data provides insight into how long it takes for the temperature to rise within rooms of the house when a fixed amount of heat input is applied. Naturally this will vary with the outdoor temperature and wind on any given day. But for no wind conditions a family of curves can be constructed to show how the room responds with varying outdoor temperatures. More information on the data logging can be found on this site at the Temperature Data Logging page.
![]()
Original Build Date:12-10-2007
Last updated 12-10-2007