 Acceleration of a Cart
Obj: Analyze the motion of an accelerating cart.
Materials: 60 Hz timer, incline, timer tape, meter stick
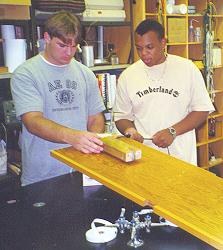
(Note: students in photo are now very old!)
Methods:
1. Attach the tape to the cart;
roll the cart down the incline with the timer on as described in class.
2. Make a data table with t,
Δd, and v as discussed in class.
Analysis:
1. Plot a displacement (d) vs.
time (t) graph; "smoothly" average the data points with a curved line.
2. Calculate the instantaneous
velocity (V0.3) using the tangent slope method discussed in
class.
3. Plot a velocity vs. time
graph; calculate the slope. What does
the slope represent?
4. Determine the total area under
the line on your V-t graph. Compare with
your data table. What does the area
represent?
5. Solve the equation d = Vit
+ ½ at2 for your final
data table time and the calculated acceleration, then compare with your total
distance (d) on your data table.
(Note: Vi can be found
on your graph. It may not equal
zero.)
6. Solve the equation Vf2
= Vi2 + 2ad for total distance (d), then compare with the
final velocity on your data table.
(Note: Vi can be found
on your graph. It may not equal zero.)
7. Your summary must compare the
shapes of both graphs, discuss the meaning of slopes on both graphs, and the area
on the v-t graph.
Back to the Brockport High School Science Department