This page shows a comparison of the general release firmware and the beta DSP firmware with reduced bandwidth waveshaping. The purpose of this change was to reduce to the keying sidebands that resulted from unshaped or unfiltered phase-continuous FSK. In all the following measurements I used a power output of 50w (typical of driving the linear amplifiers that make for loud signals) and a resolution bandwidth of approximately 3 Hz. The carrier power has been adjusted to the zero dB reference on the vertical scale.
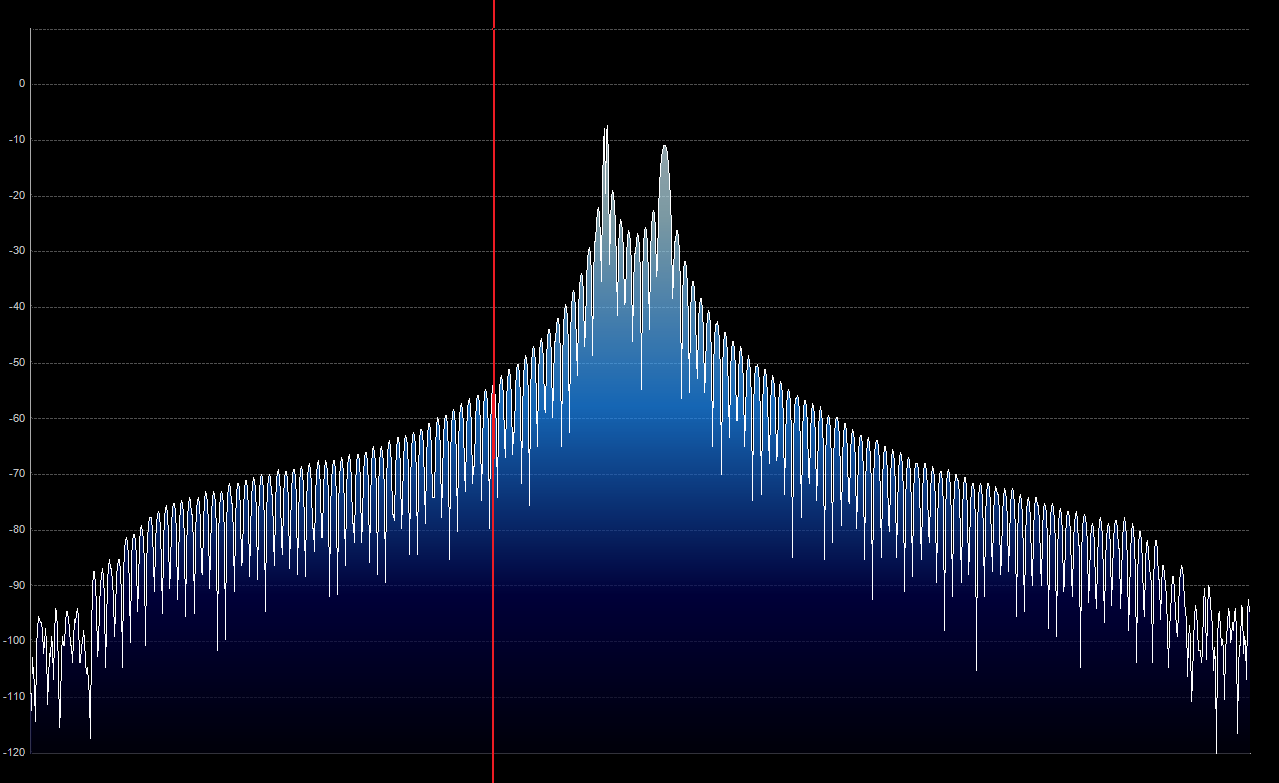
Figure 1 shows the FSK-D (internal FSK generator) spectrum in the general release firmware. It is typical of most internal FSK generators in other radios that switch a carrier back and forth between two frequencies. This instantaneous change in frequency causes the sidebands you see that spread out from the two tones. The red line is 500 Hz away from the center of the two tones (or equivalently 415 Hz below the space tone and 585Hz below the mark tone). The entire window spans about 3000 Hz. Notice that the extent of the keying sidebands is limited by the 2.8 KHz IF filter in the transmit chain.
|
Figure 2 shows the spectrum of the bandwidth-reduced FSK (beta firmware) with 50w drive. Here you can see that the keying sidebands are reduced by around 30dB at the 500 Hz line. In fact, we are likely limited by phase noise of the K3 and/or the analyzer at this level.
 |
What does this mean in practical terms? One way to look at this is by measuring the noise floor through a 300 Hz roofing filter at various distances from the transmitter. Even though the receiver has nothing to do with the occupied bandwidth of the transmitter, this is typically how we humans experience the contest, and gives us some qualitative sense of how "wide" a signal is as we tune near it. A bandwidth of 300 Hz is about as narrow as one go without introducing a large amount of ISI, so it represents a reasonable approximation of the QRM energy reaching the mark and space filters in the demodulator. A more accurate measure of the QRM from the point of the demodulator would require integration using the window function employed in the modem's filters. To keep things simple we'll just use a 300 Hz "brick wall" rectangular window provided by our roofing filter and measure the noise floor in this bandwidth.
Let's assume the signal in Figures 1 and 2 is S9+25dB, which is about -47dBm on my reciever. Let's also say I have a noise floor at S1, or -120dBm in a 300Hz BW. That means that the above signals have approximately 73dB SNR in a 300Hz BW. It is not unusual at my location to have several signals of this strength on a band at one time in a major RTTY contest, none of which are local. (I have seen as much as 85dB SNR via skywave propagation, and this is on a low dipole antenna in a noisey suburban neighborhood.) Using sampled signals on my bench I measured signal strengths at the following offsets by integrating power of the 300 Hz filter passband:
| Offset (Hz) | Normal | BW reduced |
| 0 | -47dBm (S9+25dB) | -47dBm (S9+25dB) |
| 300 | -68dBm (S9+4dB) | -91dBm (S6) |
| 400 | -80dBm (S7-8) | -104dBm (S3-4) |
| 500 | -86dBm (S7) | -113dBm (S2) |
| 600 | -88dBm (S6-7) | -117dBm (S1-2) --mostly phase noise? |
| 700 | -91dBm (S6) | Noise floor |
| 800 | -94dBm (S5-6) | Noise floor |
| 900 | -97dBm (S5) | Noise floor |
| 1000 | -99dBm (S4-5) | Noise floor |
Notice that the unshaped keying has clicks that will result in an S7 noise floor at 500 Hz spacing that very gradually flattens out to an S4 noise floor 1 KHz each side of transmitter, which is eventually limited (we hope!) by the IF filter in the transmitter. This makes it easy to see how loud signals placed every few kilohertz raises the noise floor of the entire band for everyone. The BW-reduced signal is under S2 at 500Hz and drops off very rapidly into the noise as one tunes away. It is below the S1 noise floor of the receiver when tuned more than 700 Hz away.