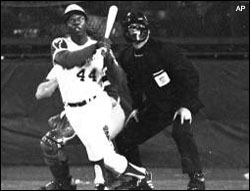
Henry (Hank) Aaron was a great home run hitter for several major league baseball teams. He holds the record for most home runs, eclipsing Babe Ruth's record of 714. The table below shows his "stats" throughout his brilliant career.
|
|
|
|
|
|
|
|
|
|
|
|
|
|
|
|
|
|
|
|
|
|
4 |
44 |
110 |
|
|
|
|
140 |
|
|
6 |
39 |
179 |
|
|
7 |
40 |
219 |
|
|
8 |
34 |
253 |
|
|
9 |
45 |
298 |
|
|
10 |
44 |
342 |
|
|
11 |
24 |
366 |
|
|
12 |
32 |
398 |
| 1966 |
13 |
44 |
442 |
|
|
14 |
39 |
481 |
|
|
15 |
29 |
510 |
|
|
16 |
44 |
554 |
|
|
17 |
38 |
592 |
|
|
18 |
47 |
639 |
|
|
19 |
34 |
673 |
|
|
20 |
40 |
713 |
|
|
21 |
20 |
733 |
|
|
22 |
12 |
745 |
|
1976 |
23 |
10 |
755 |
On
graph paper, plot the total career home runs (y axis) as a
function of years in the majors.
Label fully, then draw a "best fit line." Answer
the following questions.
1.
Which are the independent and dependent variables?
Explain why they were chosen.
2. Calculate the
slope of your "best fit line."
Include the units. What
does the slope represent?
3. By interpolation,
how many home runs would you predicted after 10.5 years in the
majors?
4. According to your
graph, how many home runs would Mr. Aaron have hit had he played
50 years in the majors? Is
this a fair assumption?
5. Explain the terms
interpolation and extrapolation.
Back to the Brockport
High School Science Department